You are here: PS Series Group Administration > Diagnosing Problems > Monitoring the Group > Using the Group Monitoring Windows
The GUI includes windows that enable you to monitor current group activity, including iSCSI connections to the group iSCSI targets, snapshot and replica schedules, replication activity, administrative login activity and history, and in-progress operations.
To show current iSCSI connections in the group, in the far left panel, click:
Group Monitoring > iSCSI Connections tab
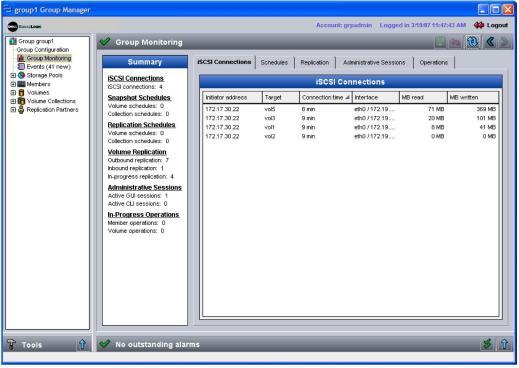
The Group Monitoring - iSCSI Connections window appears (Figure 3: Group Monitoring - iSCSI Connections ).
Figure 3: Group Monitoring - iSCSI Connections
The iSCSI Connections tab displays the iSCSI connections to iSCSI targets (volumes and snapshots), including the initiator address and the megabytes read and written since the last iSCSI connection.
To show current snapshot and replica schedules, in the far left panel, click:
Group Monitoring > Schedules tab
The Group Monitoring - Schedules window appears (Figure 4: Group Monitoring - Schedules ).
Figure 4: Group Monitoring - Schedules
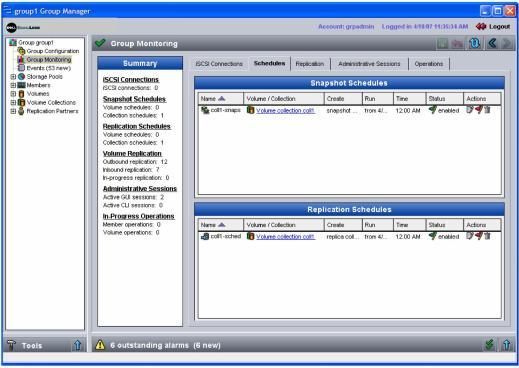
The Schedules tab displays the volumes and their schedule configurations. In the Actions column, click the icons to modify, enable or disable, or delete a schedule.
To monitor replication in the group, in the far left panel, click:
Group Monitoring > Replication tab
The Group Monitoring - Replication window appears (Figure 5: Group Monitoring - Replication ).
Figure 5: Group Monitoring - Replication
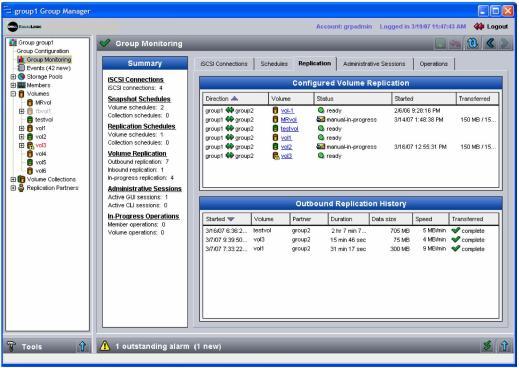
The Configured Volume Replication panel displays the volumes currently configured for replication, the direction of replication, the status, the start time, and the amount of data transferred.
For each volume, only the last 10 replication operations are shown in the Outbound Replication History panel.
To show administration session information, in the far left panel, click:
Group Monitoring > Administrative Sessions tab
The Group Monitoring - Administrative Sessions window appears (Figure 6: Group Monitoring - Administrative Sessions ).
Figure 6: Group Monitoring - Administrative Sessions
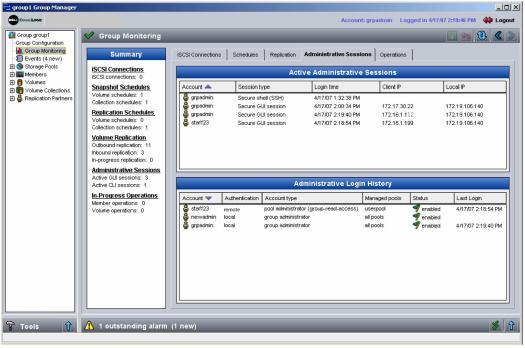
The Active Administrative Sessions panel displays the active GUI and CLI sessions and the login time. The Client IP column shows the IP address of the system running the GUI. The Local IP column shows the IP address to which the system is connected (usually the group IP address).
The Administrative History panel displays the login history for the accounts that have logged in to the group, the account type and authentication, the pools for which they have management privilege, status, and last login time.
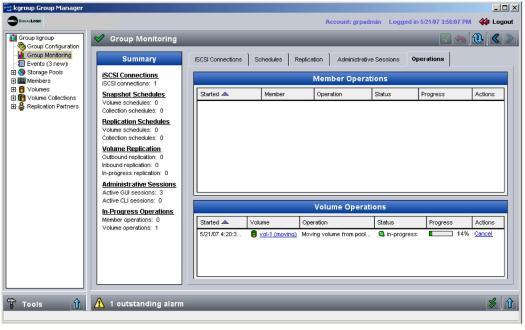
You can display in-progress operations for members (removing a member from the group or moving a member to a different pool) and volumes (moving a volume to a different pool).
To show in-progress member and volume operations, in the far left panel, click:
Group Monitoring > Operations tab
The Group Monitoring - Operations window appears (Figure 7: Group Monitoring - Operations).
If desired, you can cancel the in-progress operation by clicking Cancel.
Figure 7: Group Monitoring - Operations