You are here: PS Series Group Administration > Diagnosing Problems > Monitoring Performance Statistics
You can use the Performance Monitor to display performance statistics for a member. The Performance Monitor collects statistical data every second.
To start the Performance Monitor, click:
Members > member_name
The Member Status window appears (Figure 7: Member Status - PS5000 Array Front Panel ). In the Activities panel, click the desired component, either disks, network interfaces, IP counters, TCP counters, or UDP counters. The Performance Monitor window appears.
You can also expand the Tools panel in the lower-left corner of any main GUI window and click Performance monitor to display the Performance Monitor.
In the far left panel of the Performance Monitor window, select whether to show rates or show values.
On the left side of the task bar above the statistics panel, click the first arrow to start the data polling. Click the double-bar icon to stop polling. Once you stop polling, you can click the other arrows to navigate through the data.
On the right side of the task bar above the statistics panel, click the icons to display the statistics in a chart view, histogram view (bar graph), linear scale and logarithmic scale and to scale the display.
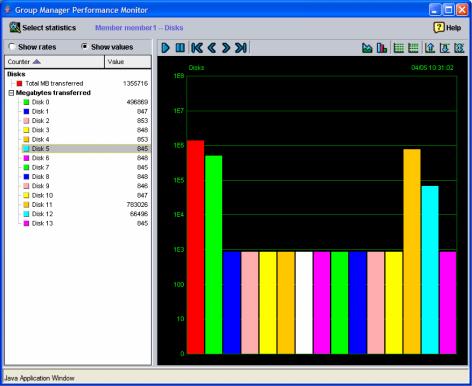
For example, if you click Disks in the Activities panel of the Member Status window and then choose to display a histogram view, the Performance Monitor - Disk Statistics window appears (Figure 8: Performance Monitor - Disk Statistics Histogram ), showing disk statistics, including total megabytes transferred to the member and megabytes for each disk.
Figure 8: Performance Monitor - Disk Statistics Histogram
To change the displayed statistics, click Select Statistics. The Select Statistics dialog box appears (Figure 9: Select Statistics ).
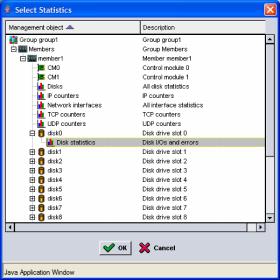
Expand the member name and double-click a component to display more statistics. To display detailed information about a disk, expand the disk and double-click Disk statistics. The Performance Monitor - Disk Statistics window appears (Figure 10: Performance Monitor - Disk Statistics), displaying I/O transfers, megabytes transferred, and errors.
Figure 10: Performance Monitor - Disk Statistics
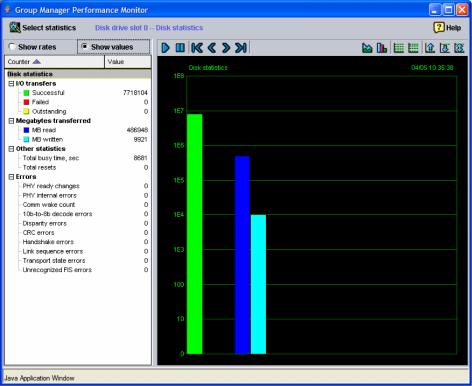
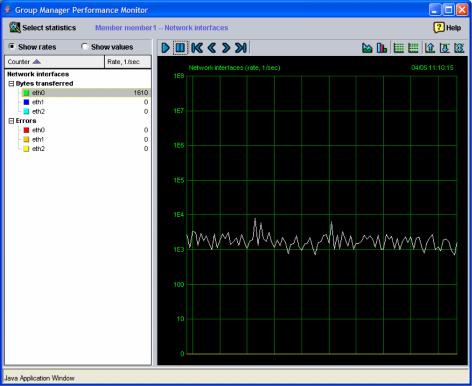
Figure 11: Performance Monitor - Network Statistics - Chart View shows an example of member network statistics displayed in a chart view, including the bytes transferred and errors for each network interface.
Figure 11: Performance Monitor - Network Statistics - Chart View